The story of atomic spectra began long before the term was even coined. It’s a tale of curiosity and discovery that spans centuries. The earliest known studies of the dispersion of light date back to the Romans, who were aware of the ability of a prism to create a rainbow of colors. However, it was Sir Isaac Newton in the 17th century who first used the word “spectrum” and demonstrated that white light could be separated into its component colors using a prism.
Fast forward to the 1800s, and we meet Joseph von Fraunhofer, who conducted detailed experiments with dispersive spectrometers. He observed dark lines in the Sun’s spectrum, which are now known as Fraunhofer lines. These lines were the first hint that each element might have its own unique spectral signature.
The real game-changer came in the 1860s with the work of German physicists Robert Bunsen and Gustav Kirchhoff. They discovered that the dark lines observed by Fraunhofer corresponded to emission lines seen in laboratory light sources. This revelation was the foundation of spectrochemical analysis, which allowed scientists to identify elements based on their spectral lines.
The development of quantum mechanics in the early 20th century further advanced our understanding of atomic spectra. Scientists like Niels Bohr proposed models of the atom that explained why atoms emitted light at specific frequencies. This led to the realization that atomic spectra were not just patterns of light but were directly related to the structure of atoms themselves.
What is Atomic Spectra?
Atomic spectra are the unique patterns of light emitted or absorbed by atoms when electrons transition between different energy levels. These patterns are like the atomic barcode for each element, revealing its identity.
Imagine you’re at a concert where every instrument plays a unique set of notes. In a similar way, atomic spectra are like the ‘notes’ that atoms play when their electrons move between different ‘musical scales,’ or energy levels.
When an atom absorbs energy, its electrons get ‘excited’ and jump to higher energy levels. But they can’t stay there for long, just like you can’t hold your breath forever. So, they ‘relax’ back to lower energy levels, and as they do, they release energy in the form of light. This light has specific colors (or wavelengths) depending on the energy difference between the levels.

Now, every atom has its own set of possible energy levels, which means each type of atom has a unique pattern of light it can emit or absorb. This pattern is what we call the atomic spectrum. It’s like a fingerprint for atoms, and just by looking at the pattern of light, scientists can tell which type of atom they’re dealing with.
Atomic spectra are related to colors because the energy transitions of electrons within atoms produce light in specific colors that we can see. It’s like each atom is painting with its own set of colors, creating a unique masterpiece that tells us about its identity and properties.
When atoms absorb energy, their electrons get excited and jump to higher energy levels. But these excited electrons can’t stay up there forever; they eventually fall back down to their original levels. As they do, they release energy in the form of light. This light is not just any light—it’s very specific in its color, which corresponds to the energy difference between the high and low energy levels.
Think of each element as an instrument in an orchestra. Just like each instrument can play notes at certain frequencies, each element can emit or absorb light at certain wavelengths. The colors we see are a result of these specific wavelengths. For example, when hydrogen atoms emit light, we often see a red color because the most intense line in hydrogen’s spectrum is in the red portion of the visible spectrum.
Each element has a unique set of energy levels, so each one has a unique pattern of light it can emit or absorb—its atomic spectrum. This is like a barcode made of colors that uniquely identifies the element. When we pass the light emitted by an element through a prism, we see its atomic spectrum as a series of colored lines, each representing a different transition of electrons between energy levels.
The visible part of the electromagnetic spectrum is what we perceive as colors, ranging from violet to red. Atomic spectra fall within this range, and that’s why we can see them as different colors. Each color corresponds to a different energy transition within the atom.
Rydberg’s Formula
Imagine you’re at an arcade, and there’s a game where you can only jump from one platform to another if you have the exact amount of energy needed. In the atomic world, Rydberg’s Formula is like the rulebook for this game, telling us how much energy is needed for an electron to make a jump between energy levels in an atom.
Rydberg’s Formula is used to calculate the wavelengths of light emitted when an electron in an atom moves from a higher energy level to a lower one. It’s given by:
\(\displaystyle \frac{1}{\lambda} = R \left( \frac{1}{n_1^2} – \frac{1}{n_2^2} \right) \)
Here, (λ) is the wavelength of the emitted light, (R) is the Rydberg constant (which is approximately (\(\displaystyle 1.097 \times 10^7 \)) per meter), and (n1) and (n2) are the principal quantum numbers of the lower and higher energy levels, respectively.
Rydberg’s Formula is crucial because it was one of the first pieces of evidence for the quantum nature of atoms. It showed that electrons can only exist at certain energy levels and that the light they emit has specific wavelengths.
Example: Let’s say an electron in a hydrogen atom jumps from the third energy level (n2 = 3) to the second level (n1 = 2). We can use Rydberg’s Formula to find out the wavelength of the light that’s emitted. This particular jump would produce light in the visible spectrum, which is part of the Balmer series that we can see as different colors.
Atomic Spectrum Of Hydrogen
Hydrogen, the simplest atom, has an atomic spectrum that consists of several series of lines. These lines are the result of electrons jumping between energy levels within the hydrogen atom.
Imagine you have a ladder with steps that are not evenly spaced: the first few steps are far apart, but as you go higher, the steps get closer together. Now, think of an electron in a hydrogen atom like a tiny person on this ladder. When the electron gets energy (like a person getting a boost), it jumps up to a higher step. But it prefers to be on the lower steps, so it doesn’t stay up for long. As it jumps back down to a lower step, it releases energy in the form of light.
This light is what we see as the atomic spectrum of hydrogen. But here’s the catch: the electron can only stand on the steps of the ladder, not in between. This means it can only release certain amounts of energy, which correspond to specific colors of light. That’s why the atomic spectrum of hydrogen isn’t a continuous rainbow but a series of distinct colored lines, each representing a jump between two steps (energy levels).
In the lab, when we pass this light through a prism, we see these distinct lines at certain positions, which form the atomic spectrum of hydrogen. Each line is like a signature for a specific energy jump, and together, they tell us how the electron moves within the hydrogen atom.
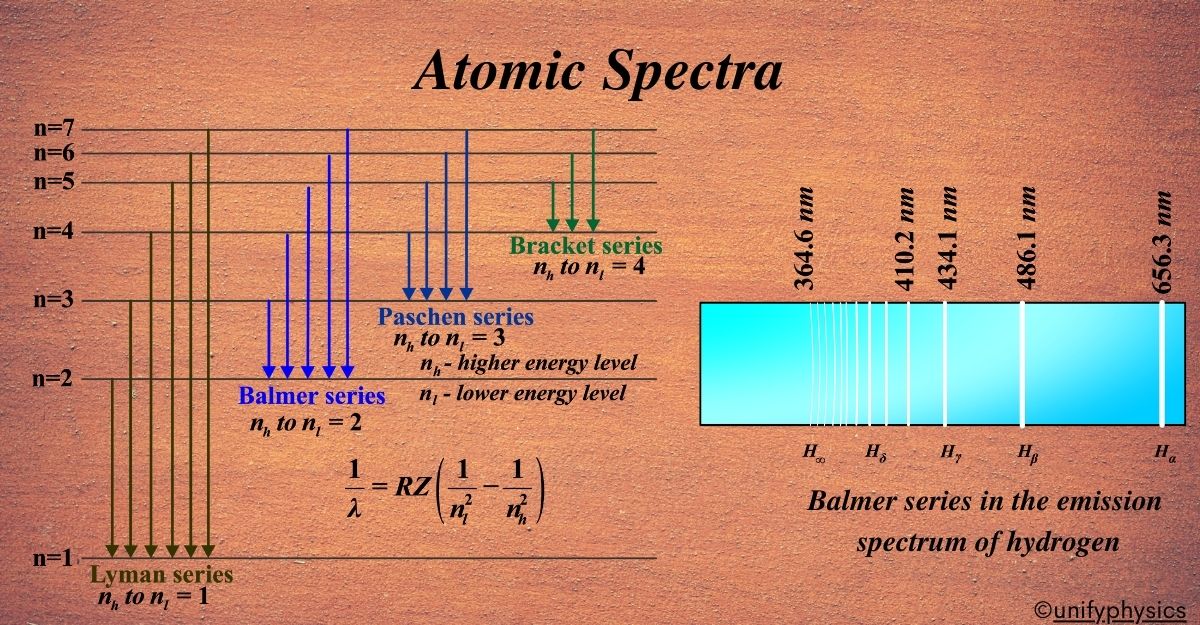
The atomic spectrum of hydrogen is particularly notable for its series of lines in the visible spectrum. When the light emitted by excited hydrogen atoms is passed through a prism, it reveals four characteristic emission lines in the colors of violet, blue, green, and red. The most intense line, which often gives hydrogen its distinctive red glow, is found in the red portion of the spectrum at 656 nm.
These lines correspond to specific transitions of the electron within the hydrogen atom as it moves between energy levels, with each color representing a different energy jump. This is why the hydrogen spectrum is not a continuous range of colors but rather a series of distinct colored lines, each associated with a particular wavelength.
So, the atomic spectrum of hydrogen is a set of specific colors of light that are emitted when the electron in a hydrogen atom jumps between different energy levels. It’s a unique pattern that helps scientists understand the behavior of electrons in the simplest atom in the universe.
Spectral Series
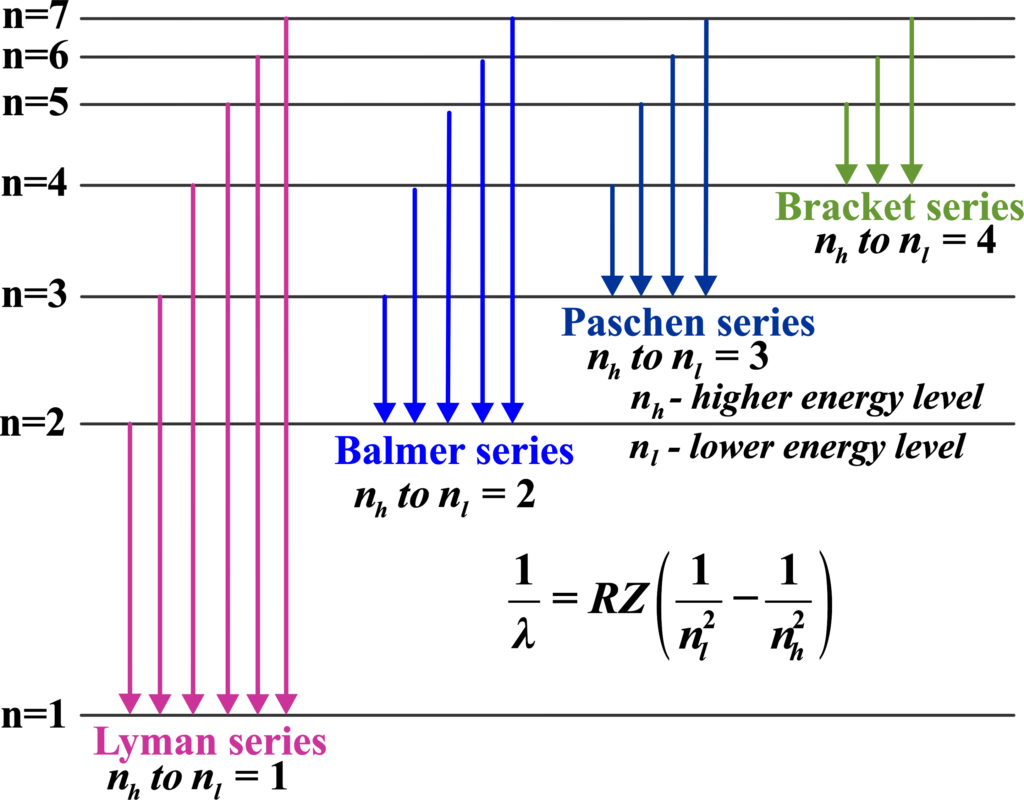
In hydrogen, there are several spectral series named after their discoverers, such as the Lyman, Balmer, and Paschen series. Each series corresponds to electrons falling to a specific lower energy level from higher ones.
Imagine an atom as a building with floors at different heights. These floors represent energy levels. Now, electrons in an atom are like people who can only stand on these floors, not in between. When electrons gain energy, they ‘jump’ to a higher floor, and when they lose energy, they ‘jump’ back down to a lower floor.
When an electron jumps down to a lower energy level, it emits light. But not just any light—each jump produces light of a specific color, which corresponds to a specific amount of energy released. These colors form a pattern of lines known as a spectral series.
Hydrogen, being the simplest atom with only one electron, has the simplest spectral series. When its electron jumps between energy levels, it creates distinct lines in the spectrum. These lines are grouped into series based on where the electron lands. Each series is named after the person who discovered it.
There are several series in the hydrogen spectrum:
Lyman series:
This series is in the ultraviolet region. It’s when the electron falls to the first energy level from the higher ones. Imagine you’re watching a fireworks show where each firework explodes at a different height and each height corresponds to a specific color. Similarly, in the atomic world, the Lyman series is like a set of ‘quantum fireworks’ that occur when an electron in a hydrogen atom makes a ‘quantum leap’ from a higher energy level to the first energy level.
The Lyman series is found in the ultraviolet region of the electromagnetic spectrum. This means the ‘colors’ or light emitted are not visible to the naked eye but can be detected with special instruments. When an electron falls from a higher energy level (like the third, fourth, or fifth) to the first level, it releases energy as ultraviolet light.
The wavelengths of the Lyman series can be calculated using a version of the Rydberg formula:
\(\displaystyle \frac{1}{\lambda} = R \left( \frac{1}{1^2} – \frac{1}{n^2} \right) \)
Here, (λ) is the wavelength of the emitted light, (R) is the Rydberg constant, and (n) is the principal quantum number of the initial energy level (n = 2, 3, 4, …). The formula shows that the wavelength depends on the energy level from which the electron descends.
The discovery of the Lyman series was crucial in the development of quantum mechanics. It provided evidence for the quantized nature of energy levels in atoms and led to a deeper understanding of electron behavior. Additionally, the Lyman series is important in astronomical spectroscopy for detecting hydrogen in the universe and calculating redshifts, which helps us understand the expansion of the universe.
Balmer series:
These lines are in the visible region, and it’s what you see when the electron falls to the second energy level. Imagine you’re an artist with a palette that only lets you use certain colors for your painting. In the world of physics, the Balmer series is like that selective palette for the hydrogen atom. It’s a set of specific colors that hydrogen can ‘paint’ with when its electron makes a particular kind of energy jump.

The Balmer series is special because it’s the part of hydrogen’s atomic spectrum that falls within the visible range of light. This means the colors of the Balmer series are the ones we can see with our eyes, ranging from red to violet.
Let’s take a real-world example from astronomy. When astronomers look at stars and nebulae, they often detect the red glow of hydrogen. This red light corresponds to a specific line in the Balmer series known as the H-alpha line. It’s the result of electrons in hydrogen atoms falling from the third energy level to the second.
The Spectral Lines (Hα, Hβ, Hγ, Hδ, H∞): Each line in the Balmer series is named using Greek letters:
Hα: This is the red line you see and it’s the result of an electron falling from the 3rd to the 2nd energy level.
Hβ: This line is cyan-colored, created when an electron falls from the 4th to the 2nd level.
Hγ: A blue line that appears when the transition is from the 5th to the 2nd level.
Hδ: Is the spectral line that appears when an electron transitions from the 6th energy level to the 2nd energy level. It is part of the visible spectrum and can be seen as a violet line at approximately 410 nm.
H∞ : Refers to the theoretical limit of the Balmer series, where the electron transitions from an infinitely high energy level to the 2nd energy level. This limit is at about 364.5 nm in the ultraviolet range. As the energy level from which the electron falls becomes very high, the lines get closer together and converge to this limit.
The different colors correspond to different amounts of energy released by the electron during the fall. The bigger the jump (from a higher level to the 2nd level), the more energy is released, and this energy determines the color of the light we see.
The wavelengths of the Balmer series can be calculated using the Balmer formula, which is a specific case of the Rydberg formula:
\(\displaystyle \frac{1}{\lambda} = R \left( \frac{1}{2^2} – \frac{1}{n^2} \right) \)
Here, (λ) is the wavelength of the emitted light, (R) is the Rydberg constant, and (n) is the principal quantum number of the initial energy level (n = 3, 4, 5, …). This formula helps us predict the exact colors of light that hydrogen can emit in the Balmer series.
The Balmer series has profound implications. It not only helps us identify hydrogen in various cosmic bodies but also serves as a tool to understand the physical conditions of stars. For instance, the intensity and width of the Balmer lines can tell us about the temperature and pressure of the star’s atmosphere. The Balmer series is not just a set of colors; it’s a direct manifestation of the quantum behavior of electrons within the hydrogen atom, jumping between specific energy levels.
Paschen series:
This series is in the infrared region, with the electron falling to the third energy level. Imagine you have a remote control that only works when you’re at a certain distance from the TV. Similarly, the Paschen series involves electrons in a hydrogen atom making ‘jumps’ from higher energy levels to the third energy level. But there’s a twist: the light emitted from these jumps is invisible to our eyes because it’s in the infrared part of the spectrum.
The Paschen series falls entirely within the infrared region, which is just beyond the red end of the visible spectrum. This means the ‘colors’ of the Paschen series are not colors we can see, but they can be detected with special instruments.
The wavelengths of the Paschen series can be calculated using a modified version of the Rydberg formula:
\(\displaystyle \frac{1}{\lambda} = R \left( \frac{1}{3^2} – \frac{1}{n^2} \right) \)
Here, (λ) is the wavelength of the emitted light, (R) is the Rydberg constant, and (n) is the principal quantum number of the initial energy level (n = 4, 5, 6, …). This formula helps us predict the wavelengths of light that are emitted when an electron falls to the third energy level.
The Paschen series is important because it helps us understand the energy transitions that are not visible to the naked eye. It’s like having a special pair of glasses that lets you ‘see’ the energy changes in the hydrogen atom that would otherwise be hidden.
The Paschen series is a set of ‘invisible colors’ that tell us about the movements of electrons in hydrogen atoms, giving us a deeper understanding of the atomic world and the nature of light, even beyond what we can see.
Brackett series:
The Brackett series is a set of ‘invisible colors’ that tell us about the movements of electrons in hydrogen atoms, giving us a deeper understanding of the atomic world and the nature of light, even beyond what we can see. Imagine you’re listening to music that has bass so deep you can’t hear it, but you can feel it. Similarly, the Brackett series is like the ‘deep bass’ of the hydrogen atom’s spectrum. It consists of ‘notes’ that are too deep for our eyes to see because they’re in the infrared part of the electromagnetic spectrum.
The Brackett series involves electrons in a hydrogen atom making jumps from higher energy levels down to the fourth energy level. These transitions release energy in the form of infrared light, which we can’t see but can detect with special instruments.
The wavelengths of the Brackett series can be calculated using a modified version of the Rydberg formula:
\(\displaystyle \frac{1}{\lambda} = R \left( \frac{1}{4^2} – \frac{1}{n^2} \right) \)
Here, (λ) is the wavelength of the emitted light, (R) is the Rydberg constant, and (n) is the principal quantum number of the initial energy level (n = 5, 6, 7, …). This formula helps us predict the wavelengths of the infrared light emitted during these transitions.
The Brackett series is important because it extends our understanding of the hydrogen atom beyond what we can see. It’s like having a tool that lets us ‘feel’ the energy changes in the atom that would otherwise be hidden from our sight.
Pfund series:
Imagine you’re using a special camera that can see heat, which is essentially infrared light. The Pfund series is like the ‘heat signature’ of the hydrogen atom. It’s a set of spectral lines that are not visible to the naked eye because they’re in the infrared part of the electromagnetic spectrum.
The Pfund series involves electrons in a hydrogen atom making jumps from higher energy levels down to the fifth energy level. These transitions release energy in the form of infrared light, which, while invisible to us, can be detected with the right instruments.
The wavelengths of the Pfund series can be calculated using a version of the Rydberg formula tailored for these transitions:
\(\displaystyle \frac{1}{\lambda} = R \left( \frac{1}{5^2} – \frac{1}{n^2} \right) \)
Here, (λ) is the wavelength of the emitted light, (R) is the Rydberg constant, and (n) is the principal quantum number of the initial energy level (n = 6, 7, 8, …). This formula helps us predict the wavelengths of the infrared light emitted during these transitions.
The Pfund series is important because it extends our understanding of the hydrogen atom beyond the visible spectrum. It’s like having a tool that lets us ‘see’ the energy changes in the atom that would otherwise be hidden from our sight.
The Pfund series is a set of ‘invisible colors’ that tell us about the movements of electrons in hydrogen atoms, giving us a deeper understanding of the atomic world and the nature of light, even beyond what we can see.
These spectral series are important because they tell us how electrons behave in atoms and what energy levels exist. They also help us identify elements based on their unique ‘color fingerprints.’ A spectral series is like a collection of colorful ‘notes’ that an atom can ‘play’ depending on how its electrons move between energy levels. It’s a fundamental concept that helps us understand the atomic world and the nature of light.
Also Read: Rutherford Alpha Scattering Experiment
Characteristics of Atomic Spectrum
An atomic spectrum can be an emission or absorption spectrum. Emission spectra show bright lines on a dark background, while absorption spectra have dark lines on a bright background. These lines represent the specific energies absorbed or emitted by electrons as they move between energy levels. An atomic spectrum is like a personal ID card for an element, showing unique information through lines and bands of colors. Here are its main characteristics:
Pure Line Spectrum: Just like a barcode has distinct lines, a pure line spectrum consists of a series of sharp, well-defined lines. Each line represents a specific wavelength of light emitted or absorbed by electrons in an atom when they jump between energy levels.
Emission and Absorption Spectra:
- Emission Spectrum: When electrons fall to lower energy levels, they emit light. This creates bright lines on a dark background, showing the specific colors the atom can emit.
- Absorption Spectrum: Conversely, when electrons absorb energy and move to higher levels, they take in certain colors from white light passing through the atom. This leaves dark lines on a bright background, indicating the absorbed colors.
Continuous Spectrum: Unlike the line spectra, a continuous spectrum shows a complete array of colors without any gaps, much like a rainbow. This occurs when light comprises a wide range of wavelengths without interruptions.
Discrete Energies: The atomic spectrum reveals that electrons in an atom can only have certain discrete energies. This means they can only exist at specific energy levels, not in between.
Quantum Jumps: The lines in an atomic spectrum are the result of ‘quantum jumps’ of electrons between energy levels. The energy difference between these levels determines the color of the line in the spectrum.
Element Identification: Each element has a characteristic atomic spectrum. By analyzing the spectrum, scientists can identify the element, much like recognizing a person by their fingerprint.
Spectral Series: While we’re not delving into specific formulas here, it’s important to know that each series in an atomic spectrum corresponds to a set of electron transitions to or from a particular energy level, resulting in a group of related spectral lines.
Conservation of Energy: The atomic spectrum also demonstrates the conservation of energy. The energy absorbed by an electron when it moves to a higher level is equal to the energy it releases as it falls back down.
These characteristics make the atomic spectrum a powerful tool for understanding the structure of atoms and the behavior of electrons. It’s like a visual language that atoms use to communicate their internal workings to us.
Atomic Spectroscopy
Atomic spectroscopy is the study of the absorption and emission of light by atoms. It’s a tool used to determine the elemental composition of a sample by analyzing its spectrum. Think of atomic spectroscopy as a detective tool that scientists use to figure out what elements are present in a substance and in what amounts. It’s like having a superpower to see the ‘DNA’ of atoms by the light they emit or absorb.
Atomic spectroscopy is the study of the electromagnetic radiation absorbed or emitted by atoms. Since every element has a unique pattern of light absorption and emission, we can use this information to identify and quantify them in various samples. When atoms are energized, their electrons get excited and move to higher energy levels. But they don’t stay there for long. They soon return to their original levels, and when they do, they release light. This light can tell us a lot about the atom:
- The Color of the Light: Different elements release different colors of light because each type of atom has its own set of energy levels.
- The Intensity of the Light: The amount of light released can tell us how much of an element is present in a sample.
Types of Atomic Spectroscopy: There are three main types of atomic spectroscopy, each based on how the atoms interact with light:
- Atomic Absorption Spectroscopy (AAS): Measures the light absorbed by atoms to determine what elements are present.
- Atomic Emission Spectroscopy (AES): Analyzes the light emitted by excited atoms to identify and quantify elements.
- Atomic Fluorescence Spectroscopy (AFS): Similar to AES, it uses the phenomenon of fluorescence to measure the light emitted by atoms.
Atomic spectroscopy is a powerful method that helps us understand the composition of substances at the most fundamental level. It’s like a universal translator for the language of atoms, spoken through the light they emit and absorb.
Limitations Or Challenges Using Atomic Spectra
Atomic spectra are a powerful tool in various scientific fields, but there are some limitations and challenges associated with their use:
Sample State: Most atomic spectroscopy techniques are designed for analyzing liquids rather than solids because the substance typically needs to be vaporized for analysis. Solids can take a long time to dissolve, and some may not dissolve at all, which limits the types of samples that can be analyzed.
Equipment Cost: The equipment used in atomic spectroscopy, while often more portable than previous instruments, can come with a high price tag. This can make it unfeasible for widespread use in all laboratories.
Interference: Other chemicals present in the sample or the surrounding atmosphere can interfere with the results. This can lead to inaccuracies if not properly accounted for during the analysis.
Sensitivity to Conditions: Atomic spectroscopy can be sensitive to experimental conditions such as temperature and pressure. Variations in these conditions can affect the accuracy of the results.
Complexity of Spectra: Some elements can produce very complex spectra with many lines, which can be difficult to interpret and require sophisticated software and expertise.
Limitations of Theory: The theoretical models used to understand atomic spectra, such as the Bohr model, have limitations. They may not account for all aspects of atomic behavior, such as the effects of magnetic fields on spectra or the Stark effect.
Detection Limits: While atomic spectroscopy is highly sensitive, there are limits to its detection capabilities. Extremely low concentrations of an element may be challenging to detect accurately.
Preparation Time: Sample preparation for atomic spectroscopy can be time-consuming, especially if the sample needs to be converted from a solid to a liquid or gas form.
Despite these challenges, atomic spectroscopy remains a crucial technique in many areas of research and industry due to its ability to provide detailed information about the elemental composition of a sample.
Application Of Atomic Spectra
Atomic spectra have a wide range of practical applications across various fields. Here are some key uses:
Elemental Analysis: Atomic spectroscopy is extensively used for elemental analysis. It’s based on the electromagnetic radiation emitted or absorbed by atoms, which allows scientists to identify and measure the concentration of different elements within a sample.
Pharmacology: In the pharmaceutical industry, atomic spectroscopy is used to determine the purity of metal catalysts in drugs. This ensures that the final product is safe and effective for consumption.
Environmental Science: Environmental scientists employ atomic spectroscopy to monitor metal pollutants in soil and water. This helps in assessing environmental health and enforcing regulations.
Metallurgy: The technique is used to identify the spectral lines of materials in metallurgy, which is crucial for quality control and material verification.
Food Industry: Atomic spectroscopy can be used to analyze the mineral content in food, ensuring nutritional value and safety for consumption.
Astronomy: Astronomers use atomic spectra to determine the composition of stars and other celestial bodies. By analyzing the light from these objects, they can infer their chemical makeup.
Medical Diagnostics: Medical laboratories can detect the type and amount of toxic metals that could be present in a patient’s urine or blood, which is vital for diagnosing certain conditions.
Mining Industry: The mining industry utilizes atomic spectroscopy to detect the presence and quantity of precious metals like gold and silver, which is essential for valuation and processing.
These applications demonstrate the versatility and importance of atomic spectra in both scientific research and industry. By understanding the unique ‘fingerprints’ of elements, we can gain valuable insights into the composition and quality of various substances and environments.
FAQs
What is an atomic spectrum?
An atomic spectrum is like a unique signature of an element that shows the specific wavelengths of light an atom emits or absorbs. It’s created when electrons in an atom jump between different energy levels, releasing or absorbing light in the process.
Why is the atomic spectrum of hydrogen important in physics?
The atomic spectrum of hydrogen is important because it’s the simplest spectrum to analyze, with only one electron to consider. It has been crucial in developing quantum mechanics and understanding how electrons behave in atoms.
What are spectral series in the context of atomic spectra?
Spectral series are groups of lines in the atomic spectrum that result from electrons transitioning between specific energy levels. Each series corresponds to a set of transitions ending or starting from a particular energy level, like the Balmer series or Lyman series in hydrogen.
How do the characteristics of an atomic spectrum help scientists?
The characteristics of an atomic spectrum, such as the line positions and intensities, help scientists identify elements and determine their abundance in a sample. They also provide insights into the structure of atoms and the energy levels of electrons.
What is atomic spectroscopy used for?
Atomic spectroscopy is used for analyzing the composition of substances. It’s widely used in fields like environmental testing, metallurgy, medicine, and astronomy to identify and quantify different elements.
Can atomic spectra tell us anything about the temperature of a star?
Yes, atomic spectra can give us clues about the temperature of a star. The types of spectral lines present and their intensities can indicate the temperature of the star’s surface, as different elements emit and absorb light at different temperatures.
What challenges do scientists face when using atomic spectroscopy?
Scientists face challenges such as the need for precise calibration, interference from other elements in the sample, and the complexity of analyzing spectra with many overlapping lines. Additionally, the equipment can be expensive and require specialized training to use effectively.